
The Extraordinary Claim
The claim of rising temperatures depends, of course, on knowing what the temperature used to be and what it is now. I’m going to be starting with now and working backwards.
The following table is copied from page 196 of Chapter2 of the IPPC’s Fifth Assessment Report.
| Data set | 1880 - 2012 |
| HadCRUT4 (Morice et al, 2012) | 0.062 ± 0.012 |
| NCDC MLOST (Vose et al, 2012b) | 0.064 ± 0.015 |
| GISS (Hansen et al, 2010) | 0.065 ± 0.015 |
The left-hand column is the data set, along with a reference to the scientific paper that describes the data set. HadCRUT4 is the world temperature data calculated by the Hadley Research Centre of the University of East Anglia in the UK. NCDC is the National Climatic Data Centre of the National Oceanic and Atmospheric Administration in the US. GISS is the Goddard Institute for Space Studies, part of the NASA in the US.
The right-hand claims to be the temperature rise per decade between the years 1800 and 2012 measured in degrees Celsius. It’s a bit of a mystery how the GISS paper by NASA’s James Hansen and others can document the temperatures in 2011 and 2012 when the paper was written in 2010, but I’ll let that go for now. These are scientists, after all, and we shouldn’t question them.
What’s fascinating are the number themselves. Take the first one: 0.062 ± 0.012.
It says “Every ten years since 1880 the Earths has warmed sixty-two one-thousandths of a degree Celsius. That number is accurate to within twelve one-thousandths of one degree Celsius.”
Wow! We know, with an accuracy of better than one one-hundredth of a degree Celsius, what the temperature of the entire Earth was over every ten-year period from 1880 to 2012.
Notice that if I want to know the rate per year, its 0.0062 ± 0.0012. These are really tiny numbers! I suppose that’s why the rate is reported per decade instead of per year.
This is particularly extraordinary as the limit of accuracy of a thermometer about 0.2 º C. That’s about 17 times greater than the claimed accuracy.
Think about that. Somehow, almost magically, the accuracy of the temperature record at every place on the Earth over a period of 132 years is 17 times greater than the accuracy or one thermometer, in one place, at one time.
How is the Earth’s temperature measured?
If you ponder the matter of measuring Earth’s temperature, you’ll soon see some of the many, many problems:
- The Earth is large, with a surface area of about 510 million square kilometres (197 million square miles) of which about 70% is water and 30% is land.
- Global warming is about warming of the atmosphere. The various bureaus of meteorology around the world measure the land surface temperature, normally with a thermometer in a standard enclosure called a Stevenson screen.
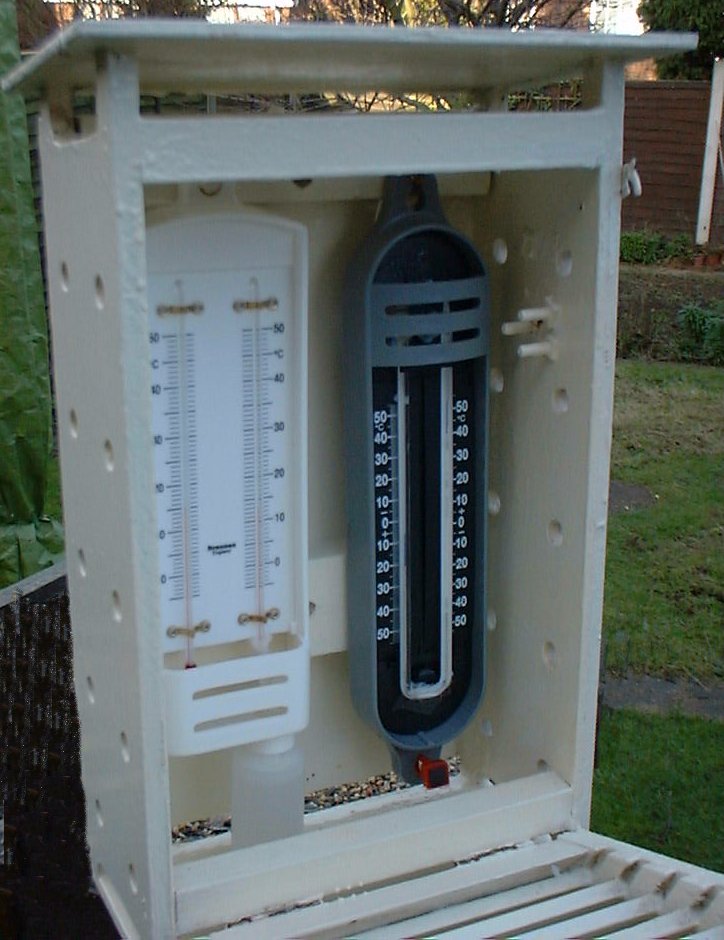 The screen is located 1.2 – 2.0 meters above the ground. The screen keeps direct sunlight from falling directly on the thermometer. Direct sunlight is just one of the multitude of things that can effect and distort temperature readings.
 - The temperature of the oceans, on the other hand, are made by ships and special buoys. These measure sea surface temperatures (SST) that, naturally, is the temperature of the water, not the temperature of the air just above the water. Water temperatures are converted to air temperatures with complex calculations.
- For the Earthly average, the land and sea temperatures are ‘blended’ with complex computer algorithms.
- Just in case all that seems straightforward, since 1979 a series of satellites have been launched that measure the temperature of the Earth from space.
Over the next several posts I’ll look at a number of the issues in the temperature record.
I’ll focus on what I believe is the main issue. The extraordinary claim of extraordinary accuracy.
One of the surface data sets, CruTEM4, the surface record for HadCRUT4, is based on data from 4828 weather stations world wide. Of these, 1760 or 37% are in North America. By comparison, just 336 or 7% are in Australia. I’ll look at the distribution of weather stations and the machinations that their raw temperature data is subjected to in a separate post.
It’s interesting to note that the Australian Bureau of Meteorology (BOM) lists 20,104 past and present weather stations in Australia. Of those, 896 or 4.5% have a World Meteorological Organisation (WMO) number. Of those only 336 or 1.7% are considered by the Hadley Climate Research Unit for inclusion in CruTEM4. Makes me wonder what’s wrong with the other 98.3%. How widespread is this practice? How many weather station are there across the world that are not considered by the climate change “authorities” like The Hadley Climate Research Unit? Another topic for another post.
To focus even closer, for this post I’ll limit myself to the surface temperatures and one type of thermometer, the maximum-minimum thermometer, sometimes called Six’s thermometer. These have been used for many years but have been replaced by newer temperature loggers that record the temperature at various intervals. Automatic weather stations used by the BOM record temperature every minute.
I’ll start with the simplest case: Measuring the average temperature at one spot. If you’ve been following this, I’ll be using data from my two temperature loggers that I’ve imaginatively named Red and Green. As before, Red and Green are located on the windowsill of my office in Traralgon, Victoria, Australia.
Another simple experiment
I’ve run Red and Green for several days collecting data every 10 seconds. In the samples shown below, I’ve only included complete 24-hour days. For each day I’ve shown the actual minimum, maximum and average temperatures using all of the available data. The Average I’ve shown is the actual average, within the 0.5 º C accuracy of the temperature logger

I’ve then calculated the average temperature the way BOM and other meteorological organisations do: I added the minimum and maximum and divided by two. That gave me the green column ‘Calculated average’.
I then subtracted the real average from the calculated average to get the error, shown in the first red column.
The second red column is the absolute error, done simply for this example, by just making any negative differences positive. I want to know how much the error is different from zero.
When I average the absolute errors, I get a 0.7 º C. In other words, every day I do this the calculated average temperature is about 0.7 º C different from the real average temperature for that day.
That’s bigger than the accuracy of the temperature logger. I’ve introduced a systematic error due to the way I calculated the average.
I’ve made my measurements less accurate, not more accurate, and by a fair margin.
I’ll look at this and other errors in the temperature records of organisations like The Hadley Climate Research Unit in later posts and leave you with this question:
How can the rate of global warming as shown by the temperature record be measured to an accuracy 17 time better that the accuracy of a thermometer?
To me, accepting that is more a matter of faith than science.
No comments:
Post a Comment
Got a comment for me?